from pathlib import Path
import numpy as np
import pandas as pd
import matplotlib.pyplot as plt
import matplotlib

print("pandas version:", pd.__version__)
print("numpy version:", np.__version__)
print("matplotlib version:", matplotlib.__version__)Clustering

The goal of this notebook is not to master every detail of machine learning, but to understand the whole game. You’ll follow the complete CRISP-DM process, from Business Understanding to Evaluation, experiencing each phase in a simple and structured way. Deployment is the final phase of CRISP-DM; in this course it is limited to saving your trained model.
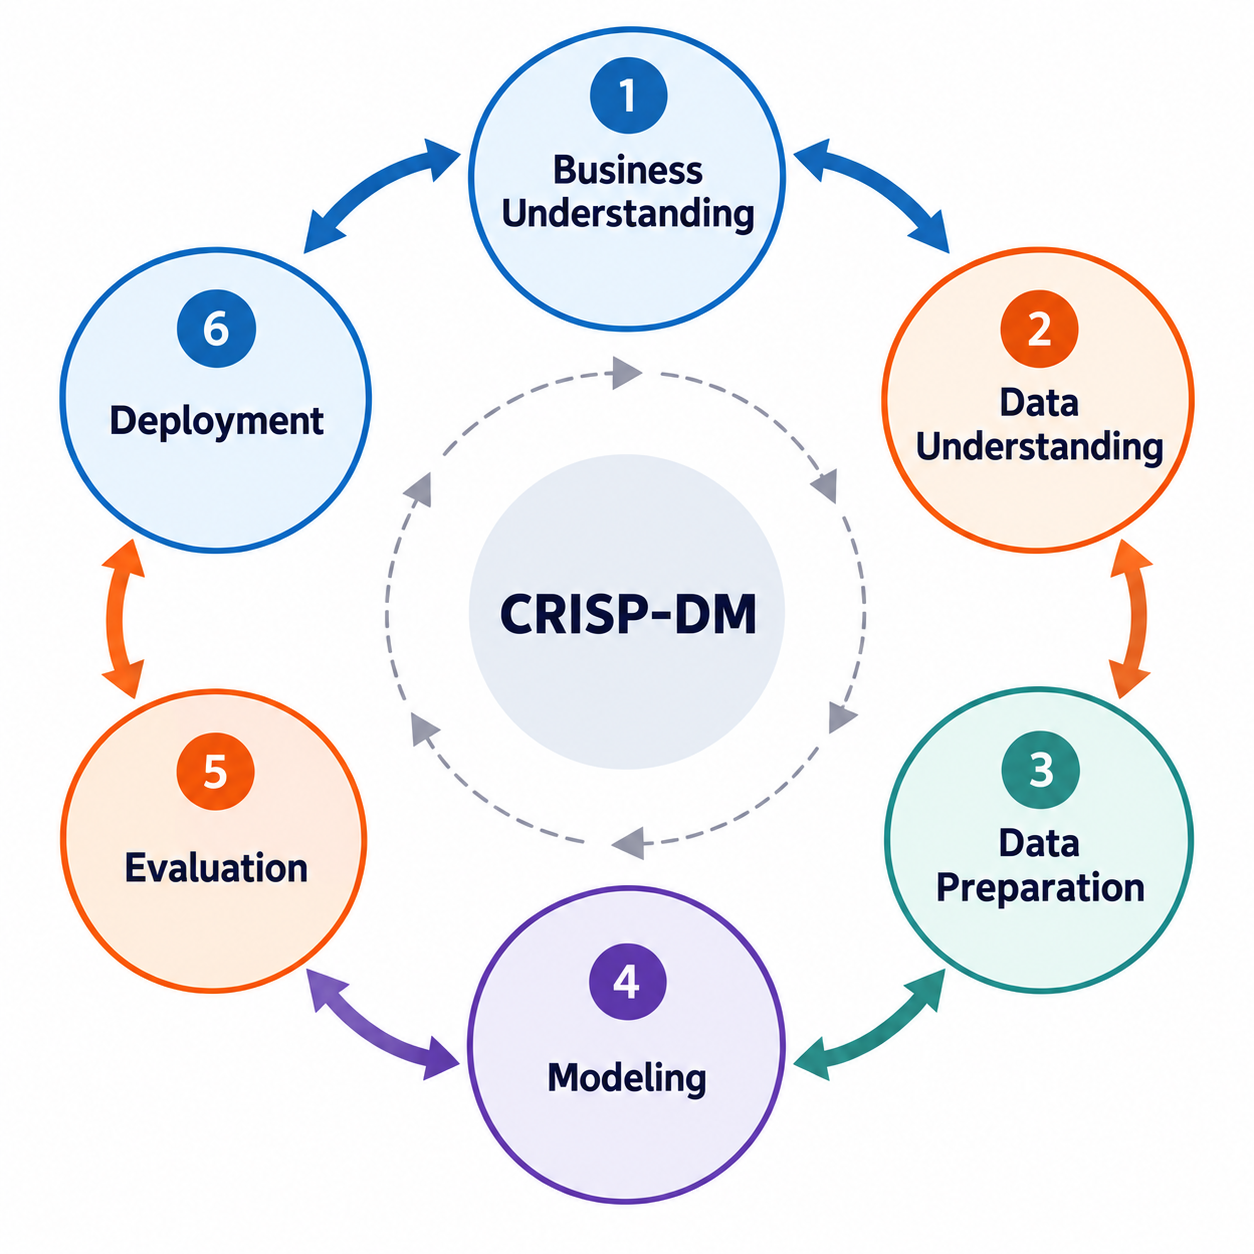
In this notebook you will work through the main phases of a data science project:
- Phase 1 – Business Understanding: Explore why predicting molecular properties is valuable and what questions we want to answer.
- Phase 2 – Data Understanding: Learn how the molecular dataset is obtained and identify which columns are inputs (features) and which is the output (target).
- Phase 3 – Data Preparation: Prepare the dataset so it can be used for training models.
- Phase 4 – Modelling: Train a clustering model to form molecule groups
- Phase 5 – Evaluation: Evaluate the clusters to identify patterns
The goal here is not to perfect each step, but to connect them and see how the entire process fits together. By the end, you’ll have experienced the full machine learning workflow and gained insight into the lifecycle of a data science project.
Let’s get started!
1. Business Understanding
You’ve already covered this in the Business Understanding page.
2. Data Understanding
You’ve already covered this in the Data Understanding page. Simply load the dataset.
Your Turn
Read starter_dataset.xlsx as a pandas dataframe into the df variable
# YOUR CODE HERE3. Data Preparation
As explained in the Data Understanding section, the dataset is already prepared for you.
- We will not remove missing values in
homo,lumo, orstability, since labels are not required for clustering. - We will keep the
smilescolumn. It will not be used as a model input, but it will be useful for evaluating the model and discovering patterns.
4. Modelling
df.head()For clustering, we only need the input features X, since this is an unsupervised learning task and there are no labels y to predict. In our dataset, the first column contain non-numerical information that should not be used as features (we will learn to encode them later), and the last three columns contain labels (homo, lumo, stability) that we do not need for clustering. Therefore, we select only the columns in between to create X.
Your Turn
Create X.
# YOUR CODE HEREYour Turn
To perform clustering, we will use the HDBSCAN algorithm. Start by importing it from sklearn.cluster, then create an HDBSCAN object with copy=True (this avoids a warning in recent scikit-learn versions), store it in a variable named hdb, and fit it to the feature matrix X. This will group similar data points into clusters without needing to specify the number of clusters in advance.
# YOUR CODE HERE5. Evaluation
As you learned, in clustering, the evaluation phase is different from classification or regression because we do not have labels to check our results against. Instead, we evaluate how good the clusters are in two ways. First, we use measures such as the silhouette score or elbow method to see if the clusters are compact and well separated. Second, we look at the clusters from a business or domain perspective to check if they make sense and are useful for the original question. In other words, evaluation is about both the quality of the clusters and their usefulness in practice.
In this project, our goal is to use clustering as a supporting step for the prediction tasks (classification and regression). For instance, clustering might reveal a molecular property that varies across clusters, which can then be added as a new feature to improve predictive models. Another application is clustering data from different sources to examine whether the source itself has an influence on the clustering patterns.
Your Turn
Retrieve the unique cluster labels assigned by the HDBSCAN model. Use np.unique on hdb.labels_ and convert the result to a Python list to see all distinct cluster IDs.
# YOUR CODE HEREYour Turn
Now evaluate the clusters using the second approach discussed above:
Examine the clusters from a business or domain perspective to determine whether they make sense and provide value for the original question.
This means looking at each cluster and trying to understand why the points in that cluster belong together. Take a closer look at the smiles column in the dataset and compare it across the clusters.
- Do you notice any differences in the way the SMILES strings look?
- Can you think of a simple, quantitative property of these strings that might vary across clusters?
- Calculate this property for the whole dataset and for each cluster, and see if any patterns emerge.
If you can find such a property, you can use it as an input feature for your classification and regression models.
For example, you might calculate the percentage of molecules in each cluster that contain a Nitrogen atom and then check whether this proportion differs across clusters, revealing a feature you can feed into your classification and regression models.
# YOUR CODE HERE