from pathlib import Path
import numpy as np
import pandas as pd
import matplotlib.pyplot as plt
import matplotlib

print("pandas version:", pd.__version__)
print("numpy version:", np.__version__)
print("matplotlib version:", matplotlib.__version__)Clustering

In the Classification and Regression notebooks, you built models that predict a target. In this last notebook of Iteration 1, you cluster the same molecules. Clustering is unsupervised: there is no target to predict, so the cycle looks a bit different. Evaluation is about whether the groups make sense, and there is no model to deploy.
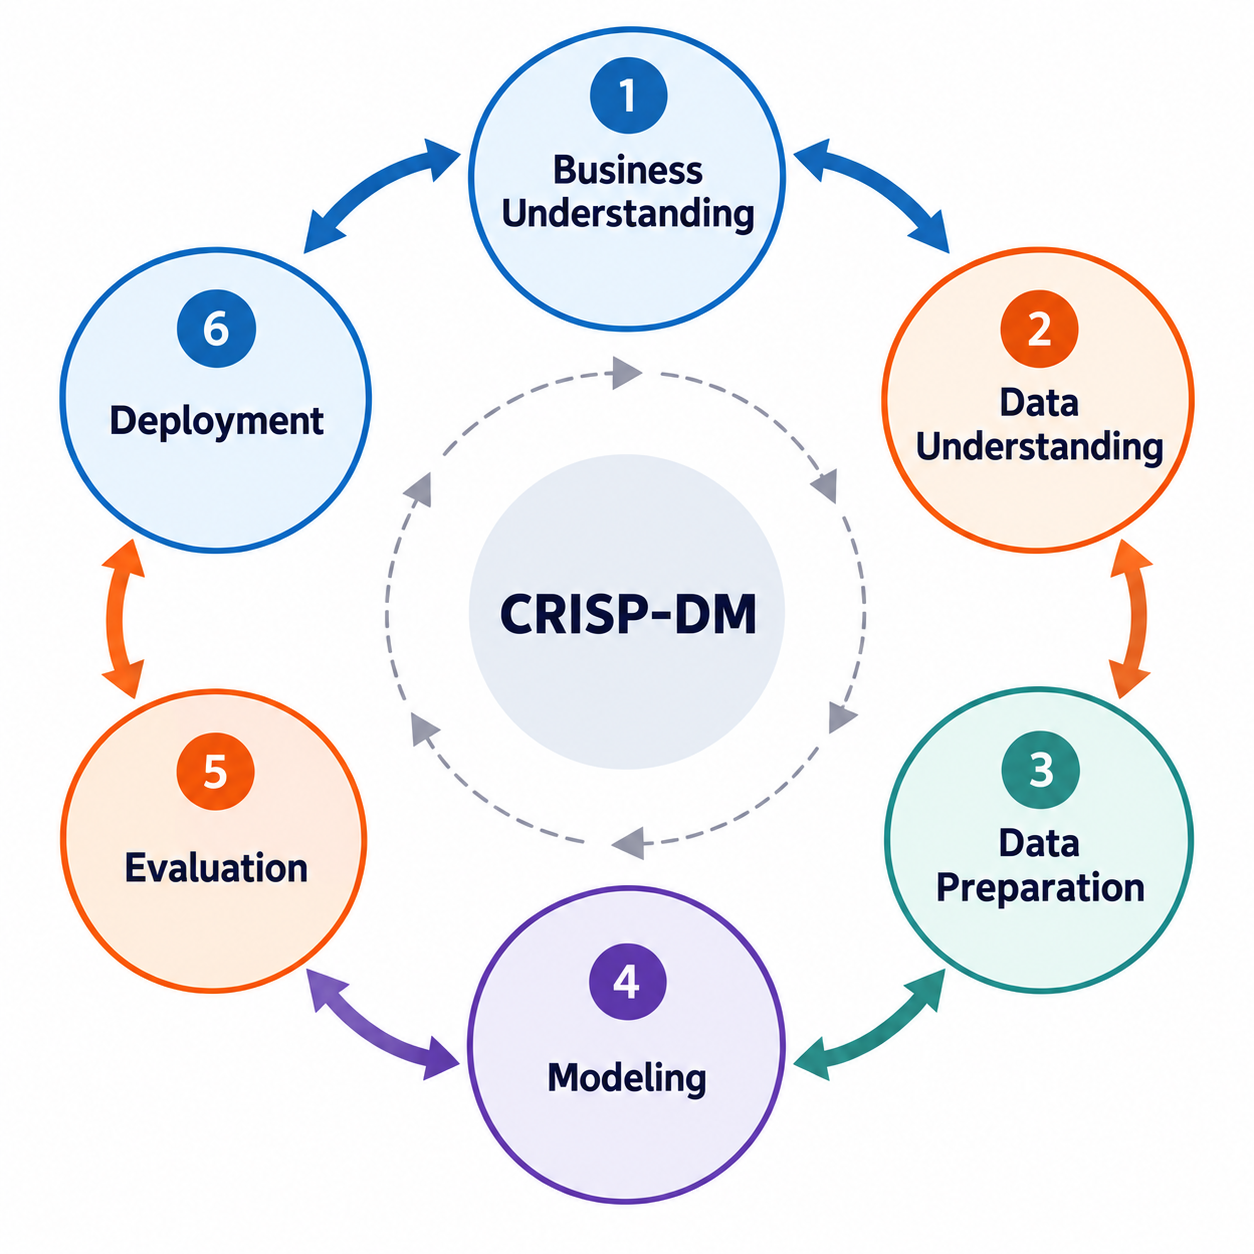
- Phase 1 – Business Understanding: ✅ Done.
- Phase 2 – Data Understanding: ✅ Done, in the Classification notebook.
- Phase 3 – Data Preparation: Hardly anything to do: clustering needs no labels.
- Phase 4 – Modelling: Train a clustering model to form groups of molecules.
- Phase 5 – Evaluation: Evaluate the clusters to identify patterns.
1. Business Understanding
Done ✅ You read the Business Understanding page.
2. Data Understanding
Done ✅ You read the Data Understanding page and explored the dataset in the Classification notebook.
Your Turn
Read starter_dataset.xlsx into the df variable, as in the Classification notebook.
Run df = df.copy() right after reading the file. pd.read_excel stores this wide table in many internal pieces, and without the copy every column you add later prints a PerformanceWarning: DataFrame is highly fragmented.
Working in Colab? The repository’s
data/folder is not available there. Pandas can read the file directly from GitHub instead:pd.read_excel("https://raw.githubusercontent.com/BredaUniversityADSAI/introduction-to-ml/stable/data/002_processed_data/starter_dataset.xlsx")
# YOUR CODE HERE3. Data Preparation
The dataset is already prepared for you. Two differences with Classification and Regression:
- You do not remove the rows where
homo,lumoorstabilityis missing, since clustering does not use labels. - You keep the
smilescolumn. It is not a model input, but you will use it to evaluate the clusters and discover patterns.
4. Modelling
df.head()For clustering, we only need the input features X, since this is an unsupervised learning task and there are no labels y to predict. In our dataset, the first column (smiles) is text that identifies the molecule, not a feature, and the last three columns contain labels (homo, lumo, stability) that we do not need for clustering. Therefore, we select only the descriptor columns in between to create X.
Your Turn
Create X.
# YOUR CODE HEREYour Turn
To perform clustering, we will use the HDBSCAN algorithm. Start by importing it from sklearn.cluster, then create an HDBSCAN object with copy=True (this avoids a warning in recent scikit-learn versions), store it in a variable named hdb, and fit it to the feature matrix X. This will group similar data points into clusters without needing to specify the number of clusters in advance.
# YOUR CODE HERE5. Evaluation
In clustering, the evaluation phase is different from classification or regression because we do not have labels to check our results against. Instead, we evaluate how good the clusters are in two ways. First, we use measures such as the silhouette score or the elbow method to see if the clusters are compact and well separated. You learn both in the Clustering notebook of the Module 3 Self-study and use them in Iteration 3; in this notebook we skip this part. Second, we look at the clusters from a business or domain perspective to check if they make sense and are useful for the original question. In other words, evaluation is about both the quality of the clusters and their usefulness in practice.
In this project, our goal is to use clustering as a supporting step for the prediction tasks (classification and regression). For instance, clustering might reveal a molecular property that varies across clusters, which can then be added as a new feature to improve predictive models. Another application is clustering data from different sources to examine whether the source itself has an influence on the clustering patterns.
Your Turn
Retrieve the unique cluster labels assigned by the HDBSCAN model. Use np.unique on hdb.labels_ and convert the result to a Python list to see all distinct cluster IDs.
# YOUR CODE HEREYour Turn
The label -1 is not a cluster: HDBSCAN gives it to noise, molecules that are not close enough to others to belong to any cluster. Count how many molecules are in each cluster and how many are noise, for example with pd.Series(hdb.labels_).value_counts().
# YOUR CODE HEREYour Turn
HDBSCAN groups molecules that are close to each other, and it measures closeness as a distance computed over all 217 descriptors at once. Look at the ranges of the descriptors: compare the minimum and maximum of each column, for example with X.describe().T sorted by max. Which descriptor has by far the largest values? What does that mean for the distances between molecules, and so for your clusters?
Hint: cluster the molecules on that one descriptor alone and compare the labels with the ones you got from all descriptors.
# YOUR CODE HEREYour Turn
Distance-based methods such as HDBSCAN need features on comparable scales. StandardScaler rescales every column to a mean of 0 and a standard deviation of 1 (the Data Preparation notebook of the Module 2 Self-study explains scaling in detail):
from sklearn.preprocessing import StandardScaler
X_scaled = StandardScaler().fit_transform(X)
Scale X with StandardScaler, fit a new HDBSCAN model (again with copy=True) on the scaled data, and look at the clusters and the noise again. What changed? Use these clusters in the next step.
# YOUR CODE HEREYour Turn
Now evaluate the clusters using the second approach discussed above:
Examine the clusters from a business or domain perspective to determine whether they make sense and provide value for the original question.
This means looking at each cluster and trying to understand why the points in that cluster belong together. Take a closer look at the smiles column in the dataset and compare it across the clusters.
- Do you notice any differences in the way the SMILES strings look?
- Can you think of a simple, quantitative property of these strings or of the molecules that might vary across clusters?
- Calculate this property for the whole dataset and for each cluster, and see if any patterns emerge.
If you can find such a property, you can use it as an input feature for your classification and regression models.
For example, you might calculate the percentage of molecules in each cluster that contain a nitrile group (a carbon atom triple-bonded to a nitrogen atom, C#N in SMILES) with the descriptor column fr_nitrile, the number of nitrile groups in the molecule, and then check whether this proportion differs across clusters, revealing a feature you can feed into your classification and regression models.
To count atoms or groups of atoms, use the descriptor columns rather than searching the SMILES text. In SMILES, aromatic atoms are written in lowercase (n for an aromatic nitrogen atom) and some elements take two letters ([Si], [se]), so a text search such as str.contains('N') misses many nitrogen atoms. You learn to read SMILES in Iteration 2. The fr_ columns count groups of atoms, such as fr_nitrile, and NumHeteroatoms counts the atoms other than carbon and hydrogen.
# YOUR CODE HERE