# Installs the missing packages on Google Colab only; does nothing locally.
import sys

if "google.colab" in sys.modules:
%pip install -q rdkitUnderstanding HOMO/LUMO Data

Before you start. Needs:
data/001_raw_data/HOPV_homolumo.data(part of the repository). Creates:data/002_processed_data/HOPV_homolumo_processed.csv, used next in Data Preparation.Paths in this notebook are relative to its folder,
modules/2_data_preparation/2_datalab/, so the data folder is../../../data/. If a file is not found, runfrom pathlib import Path; print(Path.cwd())to see where the notebook runs, and check that the earlier notebook saved its file indata/002_processed_data/.
In the previous notebook, you explored the dataset HOPV_stability.csv, which could be read directly into a pandas DataFrame. In this notebook, you will work with HOPV_homolumo.data. Unlike the CSV file, this dataset requires additional processing before it can be used in analysis.
HOPV_homolumo.data is a text file containing information on 350 molecules, the same set of molecules as in HOPV_stability.csv. While the file contains many variables, your main focus will be on:
- SMILES strings
- HOMO values
- LUMO values
The file also includes additional data. Extract these variables as well, since they may provide useful insights for further exploration.
But never use them as features. These extra columns describe the measurements and the solar cells built with each molecule: electrochemical_gap is computed from the targets themselves (it equals lumo − homo), and pce, voc, jsc and ff are measured on finished devices. None of them is known for a new molecule, such as the test molecules. A model that uses them would look excellent in validation and be useless in practice; this mistake is called data leakage. Leave out the computed values in the conformer blocks of the file as well, for another reason. They are computed from the structure of a molecule, so they are not leakage and could in principle be computed for any new molecule, but the file has them only for the HOPV molecules, not for the lab and test molecules you will predict later (see the end of the column descriptions below).
Step 1: Parse the file and organize the data into the expected tabular format, as illustrated below:
| smiles | doi | InChIKEY | construction | architecture | complement | homo | lumo | electrochemical_gap | optical_gap | pce | voc | jsc | ff | |
|---|---|---|---|---|---|---|---|---|---|---|---|---|---|---|
| 0 | Cc1ccc(-c2c3cc(-c4ccc(-c5sc(-c6cccs6)c6c… | 10.1021/ar5000743 | BOUZSMSNJFUUCG-UHFFFAOYSA-N | polymer | bulk | PC71BM | -5.40 | -3.54 | 1.86 | 1.82 | 6.83 | 0.78 | 13.29 | 66.3 |
| 1 | CN1c2ccccc2C(=C2c3ccc(-c4cccs4)cc3N(C)C2… | 10.1039/C3PY01598J | PAPOKCOIPOLVSC-BNEIJSFPSA-N | polymer | bulk | PC71BM | nan | nan | nan | nan | 3.0 | 0.89 | 5.4 | 63.0 |
| 2 | Cc1cc(-c2cc3c4nsnc4c(-c4cc(C)c(-c5cccs5)… | 10.1021/ja210687r | IKPPCQWOLGDYAQ-UHFFFAOYSA-N | polymer | bulk | PC61BM | -5.45 | -3.81 | 1.64 | 1.68 | 5.8 | 0.83 | 10.2 | 69.0 |
| 3 | Cn1c2ccccc2c2ccc(-c3ccc(-c4ccc(C5=C(c6cc… | 10.1021/ar900061z | LZAUYQACJPMHMN-UHFFFAOYSA-N | polymer | bulk | PC61BM | nan | nan | nan | 2.0 | 1.51 | 0.75 | 4.68 | 44.5 |
| 4 | Cc1cc(-c2c3cc(-c4cccs4)sc3c(-c3cc(C)c(C)… | 10.1039/C3PY01598J | RJIQMHRLDYGXFS-HYXXFLLTSA-N | polymer | bulk | PC71BM | -5.65 | -3.97 | 1.68 | nan | 5.6 | 0.9 | 10.03 | 62.0 |
| … | … | … | … | … | … | … | … | … | … | … | … | … | … | … |
| 345 | CC1(C)c2ccccc2-c2ccc(-c3ccc(C4=C(c5ccccc… | 10.1021/ar900061z | KFVMXISUDWBOQO-UHFFFAOYSA-N | polymer | bulk | PC61BM | -5.19 | -3.38 | 1.81 | 1.91 | 1.98 | 0.53 | 10.51 | 35.8 |
| 346 | Cc1ccc(-c2c3ccsc3c(-c3ccc(C)s3)c3cc(-c4c… | 10.1021/ar5000743 | FIQSDHZNBUEQOK-UHFFFAOYSA-N | polymer | bulk | PC71BM | -5.57 | -3.79 | 1.78 | 1.633 | 5.9 | 0.80 | 11.4 | 65.0 |
| 347 | C[Si]1(C)c2ccccc2-c2ccc(-c3ccc(-c4ccc(-c… | 10.1039/b9py00325h | KSAPXMCRKXFLEP-UHFFFAOYSA-N | polymer | bulk | PC61BM | -5.44 | nan | nan | 1.8 | 4.4 | 0.9 | 9.5 | 51.0 |
| 348 | N#CC(=Cc1ccc(C=Cc2ccc(-c3ccc(N(c4ccccc4)… | 10.1039/B908802D | ZVGFLVHIOZGBRL-SGVMFCADSA-N | molecule | DSSC | TiO2 | nan | nan | nan | nan | 2.73 | 0.635 | 6.55 | 66.0 |
| 349 | C=Cc1cc(OC)c(C=Cc2ccc(N(c3ccccc3)c3ccc(C… | 10.1021/ma100943t | BXWZTSDIKYVFBE-OGVDJYGPSA-N | polymer | bulk | PC61BM | -5.30 | -3.49 | 1.81 | 1.71 | 4.02 | 0.89 | 8.03 | 56.0 |
350 rows × 14 columns
Expected output format.
Step 2: Perform the same exploratory checks and analyses you applied to HOPV_stability.csv, this time on the data from HOPV_homolumo.data.
Working in Colab? This notebook uses rdkit, which Colab does not include. Run the cell below: it installs the package only when it detects Colab. Locally it does nothing, because the course environment already includes rdkit.
# IMPORT WHAT YOU NEED HEREYour Turn
Read HOPV_homolumo.data and print the first 10 lines. This lets us take a first look at the raw text and get a sense of the file’s structure before we start parsing it.
Working in Colab? The repository’s
data/folder is not available there. Download the file into your Colab session first, then use"HOPV_homolumo.data"as the path:!wget -q https://raw.githubusercontent.com/BredaUniversityADSAI/introduction-to-ml/stable/data/001_raw_data/HOPV_homolumo.data
# YOUR CODE HEREThis time, each row does not simply correspond to a SMILES string and its targets.
Your Turn
How many lines are there? Expected answer is 374852.
# YOUR CODE HEREFrom the Data Understanding page of Iteration 1, we know that this file contains data on 350 molecules. This means:
num_molecules = 350
print(f"On average, there are {len(lines)/num_molecules:.3f} lines per molecule")
To determine how to extract the values for each molecule, you will need to consult the paper.
Step 1: Parse the file and organize the data into the expected tabular format
Your Turn
Take a look at Table 1 in the HOPV data descriptor (Lopez et al., 2016, open access) and answer the following:
- Which line contains the SMILES string?
- Which line contains the experimental data?
Keep in mind the fact that Python is zero indexed.
Your Turn
Now extract the corresponding lines. Expected output:
SMILES should be:
'Cc1ccc(-c2c3cc(-c4ccc(-c5sc(-c6cccs6)c6cc(S(C)(=O)=O)sc65)s4)sc3c(-c3ccc(C)s3)c3ccsc32)s1\n'
experimental values should be:
'10.1021/ar5000743,BOUZSMSNJFUUCG-UHFFFAOYSA-N,polymer,bulk,PC71BM,-5.40,-3.54,1.86,1.82,6.83,0.78,13.29,66.3\n'
# YOUR CODE HERE
smiles_line = None
# YOUR CODE HERE
experimental_line = NoneNotice the \n character at the end of the lines. When working with text data, always account for newline characters (\n) by handling or removing them as needed.
Your Turn
Table 2 in the data descriptor document describes the CSV format for storing experimental information (experimental_line above).
Write a function called experimental_vals_to_dict to parse the experimental line and return a dictionary where each key is from Table 2 and corresponding experimental values are from the line itself.
Call the function with the experimental line you extracted previously.
output_dictionary = experimental_vals_to_dict(table2_keys, experimental_line)
The expected output is:
{'doi': '10.1021/ar5000743',
 'InChIKEY': 'BOUZSMSNJFUUCG-UHFFFAOYSA-N',
 'construction': 'polymer',
 'architecture': 'bulk',
 'complement': 'PC71BM',
 'homo': '-5.40',
 'lumo': '-3.54',
 'electrochemical_gap': '1.86',
 'optical_gap': '1.82',
 'pce': '6.83',
 'voc': '0.78',
 'jsc': '13.29',
 'ff': '66.3'}
Note that the numbers are kept as strings, we will handle those later.
table2_keys = [
    'doi',
    'InChIKEY',
    'construction',
    'architecture',
    'complement',
    'homo',
    'lumo',
    'electrochemical_gap',
    'optical_gap',
    'pce',
    'voc',
    'jsc',
    'ff'
]
def experimental_vals_to_dict(table2_keys, experimental_line):
"""
Convert a single line of experimental data into a dictionary.
Each line of data is a comma-separated string (CSV format) that contains
values such as doi, InChIKEY, molecular properties, and experimental results.
The provided list of keys is matched to these values to create a dictionary.
Parameters
----------
table2_keys : list of str
The list of column names (keys) to assign to each value.
experimental_line : str
A string containing one line of comma-separated values.
Returns
-------
dict
A dictionary where the keys come from `table2_keys` and the values
come from `experimental_line`.
"""
# YOUR CODE HERE
d = None
return doutput_dictionary = experimental_vals_to_dict(table2_keys, experimental_line)
output_dictionaryYour Turn
We have all the information we need from the first molecule in the file, the SMILES string and the experimental values containing HOMO and LUMO. Let’s put them together into a dataframe of single row.
| smiles | doi | InChIKEY | construction | architecture | complement | homo | lumo | electrochemical_gap | optical_gap | pce | voc | jsc | ff | |
|---|---|---|---|---|---|---|---|---|---|---|---|---|---|---|
| 0 | Cc1ccc(-c2c3cc(-c4ccc(-c5sc(-c6cccs6)c6c… | 10.1021/ar5000743 | BOUZSMSNJFUUCG-UHFFFAOYSA-N | polymer | bulk | PC71BM | -5.40 | -3.54 | 1.86 | 1.82 | 6.83 | 0.78 | 13.29 | 66.3 |
1 rows × 14 columns
Expected output.
# YOUR CODE HEREYour Turn
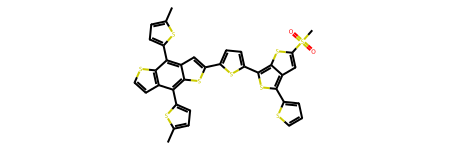
Display the molecule in the notebook based on the SMILES string using RDKit. You can use the function MolFromSmiles for this. It converts a SMILES string into a molecule object that Jupyter can display directly.
from rdkit.Chem import MolFromSmiles

mol = MolFromSmiles(# put the string here)
mol  # Jupyter will automatically display the molecule
documentation:
https://www.rdkit.org/docs/source/rdkit.Chem.rdmolfiles.html#rdkit.Chem.rdmolfiles.MolFromSmiles
# YOUR CODE HEREYour Turn
Extend your approach to all 350 molecules in the file. We estimated earlier that there are about 1071 lines per molecule, but this is only an average, some molecules have fewer lines, others more. Therefore, you cannot simply slice the file like this:
molecule_1 = line[0:1071]
molecule_2 = line[1071:1071*2]
...
Instead, you must identify a repeated structure in the file that marks where one molecule ends and the next begins.
Notice that the file does not contain simple labels like Molecule 1, Molecule 2, etc. It’s up to you to explore the text and discover a consistent pattern that can be used to determine the boundaries of each molecule. Your goal is not to extract everything, but at minimum to locate the SMILES line and the experimental line for each molecule.
Open the text file and scroll through it carefully. Look for repeated markers that indicate the start of a new molecule. Once you have a candidate pattern, test it by counting how many times it appears. If your count is 350, you’ve found the right boundary marker.
counter = 0
for line in lines:
    # YOUR CODE HERE
    # write some logic to count the molecules
    # counter should print 350
    counter += 1
print(counter)
Your Turn
Using the logic above write a function called hopv_parser to find all the molecules and extract the SMILES and the experimental line, store it into a dataframe. Expected output:
| smiles | doi | InChIKEY | construction | architecture | complement | homo | lumo | electrochemical_gap | optical_gap | pce | voc | jsc | ff | |
|---|---|---|---|---|---|---|---|---|---|---|---|---|---|---|
| 0 | Cc1ccc(-c2c3cc(-c4ccc(-c5sc(-c6cccs6)c6c… | 10.1021/ar5000743 | BOUZSMSNJFUUCG-UHFFFAOYSA-N | polymer | bulk | PC71BM | -5.40 | -3.54 | 1.86 | 1.82 | 6.83 | 0.78 | 13.29 | 66.3 |
| 1 | CN1c2ccccc2C(=C2c3ccc(-c4cccs4)cc3N(C)C2… | 10.1039/C3PY01598J | PAPOKCOIPOLVSC-BNEIJSFPSA-N | polymer | bulk | PC71BM | nan | nan | nan | nan | 3.0 | 0.89 | 5.4 | 63.0 |
| 2 | Cc1cc(-c2cc3c4nsnc4c(-c4cc(C)c(-c5cccs5)… | 10.1021/ja210687r | IKPPCQWOLGDYAQ-UHFFFAOYSA-N | polymer | bulk | PC61BM | -5.45 | -3.81 | 1.64 | 1.68 | 5.8 | 0.83 | 10.2 | 69.0 |
| 3 | Cn1c2ccccc2c2ccc(-c3ccc(-c4ccc(C5=C(c6cc… | 10.1021/ar900061z | LZAUYQACJPMHMN-UHFFFAOYSA-N | polymer | bulk | PC61BM | nan | nan | nan | 2.0 | 1.51 | 0.75 | 4.68 | 44.5 |
| 4 | Cc1cc(-c2c3cc(-c4cccs4)sc3c(-c3cc(C)c(C)… | 10.1039/C3PY01598J | RJIQMHRLDYGXFS-HYXXFLLTSA-N | polymer | bulk | PC71BM | -5.65 | -3.97 | 1.68 | nan | 5.6 | 0.9 | 10.03 | 62.0 |
| … | … | … | … | … | … | … | … | … | … | … | … | … | … | … |
| 345 | CC1(C)c2ccccc2-c2ccc(-c3ccc(C4=C(c5ccccc… | 10.1021/ar900061z | KFVMXISUDWBOQO-UHFFFAOYSA-N | polymer | bulk | PC61BM | -5.19 | -3.38 | 1.81 | 1.91 | 1.98 | 0.53 | 10.51 | 35.8 |
| 346 | Cc1ccc(-c2c3ccsc3c(-c3ccc(C)s3)c3cc(-c4c… | 10.1021/ar5000743 | FIQSDHZNBUEQOK-UHFFFAOYSA-N | polymer | bulk | PC71BM | -5.57 | -3.79 | 1.78 | 1.633 | 5.9 | 0.80 | 11.4 | 65.0 |
| 347 | C[Si]1(C)c2ccccc2-c2ccc(-c3ccc(-c4ccc(-c… | 10.1039/b9py00325h | KSAPXMCRKXFLEP-UHFFFAOYSA-N | polymer | bulk | PC61BM | -5.44 | nan | nan | 1.8 | 4.4 | 0.9 | 9.5 | 51.0 |
| 348 | N#CC(=Cc1ccc(C=Cc2ccc(-c3ccc(N(c4ccccc4)… | 10.1039/B908802D | ZVGFLVHIOZGBRL-SGVMFCADSA-N | molecule | DSSC | TiO2 | nan | nan | nan | nan | 2.73 | 0.635 | 6.55 | 66.0 |
| 349 | C=Cc1cc(OC)c(C=Cc2ccc(N(c3ccccc3)c3ccc(C… | 10.1021/ma100943t | BXWZTSDIKYVFBE-OGVDJYGPSA-N | polymer | bulk | PC61BM | -5.30 | -3.49 | 1.81 | 1.71 | 4.02 | 0.89 | 8.03 | 56.0 |
350 rows × 14 columns
Expected output.
def hopv_parser(lines):
    """
    EXPLAIN HOW IT WORKS HERE

    Parameters
    ----------
    lines : list of str
        Lines read from a HOPV_homolumo.data file.

    Returns
    -------
    pandas.DataFrame
        DataFrame where each row corresponds to a molecule.

    """
    # YOUR CODE HERE
    df = None
    return df
df = hopv_parser(lines)
dfNow we are ready for data understanding. However, before doing so, save the dataframe as a csv file so that the next we would like to use this dataset we do not have to parse HOPV_homolumo.data.
Save the DataFrame as HOPV_homolumo_processed.csv into the folder 002_processed_data.
# YOUR CODE HEREStep 2: Data Understanding
Your Turn
Great job! You’ve successfully converted the raw data into a table in the desired format. Now we can investigate the dataframe.
Let’s first look at handling empty values. Run the following code df.isna().any(). It returns a Boolean Series where each column is marked True if it contains at least one NaN value, and False otherwise. Answer the following:
Which columns contain empty values?
# YOUR CODEIt seems there are no NaN values, yet the DataFrame summary clearly shows missing values. Why does this happen?
| smiles | doi | InChIKEY | construction | architecture | complement | homo | lumo | electrochemical_gap | optical_gap | pce | voc | jsc | ff | |
|---|---|---|---|---|---|---|---|---|---|---|---|---|---|---|
| 0 | Cc1ccc(-c2c3cc(-c4ccc(-c5sc(-c6cccs6)c6c… | 10.1021/ar5000743 | BOUZSMSNJFUUCG-UHFFFAOYSA-N | polymer | bulk | PC71BM | -5.40 | -3.54 | 1.86 | 1.82 | 6.83 | 0.78 | 13.29 | 66.3 |
| 1 | CN1c2ccccc2C(=C2c3ccc(-c4cccs4)cc3N(C)C2… | 10.1039/C3PY01598J | PAPOKCOIPOLVSC-BNEIJSFPSA-N | polymer | bulk | PC71BM | nan | nan | nan | nan | 3.0 | 0.89 | 5.4 | 63.0 |
| 2 | Cc1cc(-c2cc3c4nsnc4c(-c4cc(C)c(-c5cccs5)… | 10.1021/ja210687r | IKPPCQWOLGDYAQ-UHFFFAOYSA-N | polymer | bulk | PC61BM | -5.45 | -3.81 | 1.64 | 1.68 | 5.8 | 0.83 | 10.2 | 69.0 |
| 3 | Cn1c2ccccc2c2ccc(-c3ccc(-c4ccc(C5=C(c6cc… | 10.1021/ar900061z | LZAUYQACJPMHMN-UHFFFAOYSA-N | polymer | bulk | PC61BM | nan | nan | nan | 2.0 | 1.51 | 0.75 | 4.68 | 44.5 |
| 4 | Cc1cc(-c2c3cc(-c4cccs4)sc3c(-c3cc(C)c(C)… | 10.1039/C3PY01598J | RJIQMHRLDYGXFS-HYXXFLLTSA-N | polymer | bulk | PC71BM | -5.65 | -3.97 | 1.68 | nan | 5.6 | 0.9 | 10.03 | 62.0 |
| … | … | … | … | … | … | … | … | … | … | … | … | … | … | … |
| 345 | CC1(C)c2ccccc2-c2ccc(-c3ccc(C4=C(c5ccccc… | 10.1021/ar900061z | KFVMXISUDWBOQO-UHFFFAOYSA-N | polymer | bulk | PC61BM | -5.19 | -3.38 | 1.81 | 1.91 | 1.98 | 0.53 | 10.51 | 35.8 |
| 346 | Cc1ccc(-c2c3ccsc3c(-c3ccc(C)s3)c3cc(-c4c… | 10.1021/ar5000743 | FIQSDHZNBUEQOK-UHFFFAOYSA-N | polymer | bulk | PC71BM | -5.57 | -3.79 | 1.78 | 1.633 | 5.9 | 0.80 | 11.4 | 65.0 |
| 347 | C[Si]1(C)c2ccccc2-c2ccc(-c3ccc(-c4ccc(-c… | 10.1039/b9py00325h | KSAPXMCRKXFLEP-UHFFFAOYSA-N | polymer | bulk | PC61BM | -5.44 | nan | nan | 1.8 | 4.4 | 0.9 | 9.5 | 51.0 |
| 348 | N#CC(=Cc1ccc(C=Cc2ccc(-c3ccc(N(c4ccccc4)… | 10.1039/B908802D | ZVGFLVHIOZGBRL-SGVMFCADSA-N | molecule | DSSC | TiO2 | nan | nan | nan | nan | 2.73 | 0.635 | 6.55 | 66.0 |
| 349 | C=Cc1cc(OC)c(C=Cc2ccc(N(c3ccccc3)c3ccc(C… | 10.1021/ma100943t | BXWZTSDIKYVFBE-OGVDJYGPSA-N | polymer | bulk | PC61BM | -5.30 | -3.49 | 1.81 | 1.71 | 4.02 | 0.89 | 8.03 | 56.0 |
350 rows × 14 columns
nan values are visible on homo, lumo and the gap columns.
To understand why, let’s take a single nan value and check its type:
df.iloc[1]['homo']type(df.iloc[1]['homo'])As you can see, the issue is that the text file encodes missing values as the string "nan" rather than as actual NaN values. As a result, Python and pandas interpret them as regular non-empty strings. To handle them correctly as missing data, we need to replace these strings with np.nan.
pd.isna('nan') # 'nan' is not really nanpd.isna(np.nan) # np.nan is what we wantYour Turn
Replace all "nan" values with np.nan and run the code df.isna().any() to identify columns that contain empty values
# YOUR CODE HEREAs you can see, almost every column contains empty values except for the smiles column. The key takeaway is that you must approach your data like a detective. Just because df.isna().any() didn’t flag any empty columns doesn’t mean there aren’t missing values, even if your code is technically correct. You will face many such situations in data science and machine learning. The only way to handle them properly is by knowing the fundamentals and by staying skeptical.
Your Turn
Calculate the number of rows that fall into each category:
- Both HOMO and LUMO are present (expected 233) - HOMO is present and LUMO is missing (expected 12) - HOMO is missing and LUMO is present (expected 0) - Both HOMO and LUMO are missing (expected 105)
# YOUR CODE HEREYour Turn
Next, check for duplicates in the SMILES column. Why do we care about duplicates?
# YOUR CODE HEREYour Turn
Remember when we were parsing the experimental line, we left the numbers as strings. It is time to convert them to floats, so that we can calculate some descriptive statistics on them and plot their distribution.
- Check the data type of each column
- Identify which columns should be converted to numerical data types
- Identify if these are to be convert to a
floatorint - Do the conversion
- Convert the remaining columns to
string - Check the data type of each column to verify conversion
Note: In pandas 3, the version of this course, text read from a file has the dtype str. Older pandas versions (for example on Colab) show object instead: pandas is built on NumPy, which has no type for text of variable length, so text used to be stored as generic Python objects. The string dtype you convert to here is pandas’ explicit text type, with proper support for missing values (<NA>).
Expected output:
smiles                  string
doi                     string
InChIKEY                string
construction            string
architecture            string
complement              string
homo                   float64
lumo                   float64
electrochemical_gap    float64
optical_gap            float64
pce                    float64
voc                    float64
jsc                    float64
ff                     float64
# YOUR CODE HERENow that we have parsed the text file, cleaned out empty values, and converted the columns to the correct data types, we can take a closer look at the dataset. While the data descriptor document specifies what each field represents, the meanings may not be immediately clear without a chemistry background. Below is a plain-language explanation of each column, prepared with the help of ChatGPT.
About the values in this file. The molecules and the columns that describe the experiments (DOI, InChIKEY, construction, architecture, complement) are as published, and so is the fill factor. HOMO, LUMO and the electrochemical gap are synthetically generated, like all target values in this course (see the Data Understanding page of Iteration 1). The optical gap, PCE, VOC and JSC are the published values, adjusted to the synthetic HOMO and LUMO of each molecule, so that the relations between the columns stay realistic. None of these numbers is the published measurement, so you will not find them in the papers.
Digital Object Identifier (DOI)
- A permanent identifier of the research paper where the experiment was published.
- Useful for tracing back to the original experimental setup and conditions.
InChIKEY of molecule
- A hashed version of the InChI (International Chemical Identifier) string.
- Provides a unique, compact ID for the molecule.
- Unlike SMILES, it is not used for feature extraction. Normally it identifies a molecule and links it to chemical databases, but in this file it does not match the SMILES of its row in most cases: RDKit computes the same key from the SMILES for only 9 of the 350 rows. Identify the molecules by their canonical SMILES instead (see Understanding SMILES).
Construction (Polymer / Molecule)
- Whether the active layer material is a single small molecule or a polymer.
- This affects how molecules are processed experimentally, and may correlate with properties like stability or efficiency.
Architecture
- The type of device structure used in the solar cell (e.g., bulk heterojunction).
- Relevant for interpreting performance metrics, but not directly a molecular property.
Complement
- The electron acceptor or donor material paired with the molecule in the solar cell.
- For example, PCBM derivatives are often listed here.
- This is important for device-level performance
HOMO (Highest Occupied Molecular Orbital)
- The energy level of the highest filled electron orbital (in eV).
- A molecular property that influences how easily the molecule donates electrons.
- Prediction target for your ML task.
LUMO (Lowest Unoccupied Molecular Orbital)
- The energy level of the lowest empty electron orbital (in eV).
- Indicates how easily the molecule can accept electrons.
- Prediction target for your ML task.
Electrochemical gap
- The difference between LUMO and HOMO (LUMO − HOMO); in this file it is computed from the two columns above.
- In the original HOPV data, HOMO and LUMO were measured experimentally, often with cyclic voltammetry. In this course they are synthetic (see the note above).
- A rough estimate of the energy needed to excite the molecule. (The open-circuit voltage of a device depends mainly on the offset between the HOMO of the donor and the LUMO of the acceptor, see VOC below.)
Optical gap
- The band gap inferred from absorption spectra (UV-Vis).
- Related but not identical to the HOMO-LUMO gap because of excitonic effects.
PCE (Power Conversion Efficiency)
- Percentage of sunlight converted into electricity by the device.
- A device-level metric, depends not only on the molecule but also the architecture and complement.
VOC (Open-Circuit Voltage)
- The maximum voltage a device can deliver when no current flows.
- Influenced by HOMO of donor and LUMO of acceptor.
JSC (Short-Circuit Current Density)
- Current per unit area when the circuit is shorted.
- Related to how well the molecule absorbs light and generates charge carriers.
Fill Factor (FF)
- A measure of how “square” the current–voltage curve is.
- Affects the efficiency of the solar cell.
The rest of the file: after the experimental line, each molecule has one or more conformers (3D structures of the molecule). For each conformer there is the number of atoms, one line per atom with its coordinates, and four lines with properties computed with density functional theory (DFT), one for each computational method (B3LYP, BP86, M06-2X and PBE0). Each of these lines gives the computed HOMO, LUMO and gap in Hartree (1 Hartree = 27.211 eV), followed by the PCE, VOC and JSC that the Scharber model predicts from them. The computed values are the published ones and are not adjusted. They are not targets, and they are not good features either: they are strongly related to the targets (the B3LYP LUMO and the lumo column have a correlation of 0.81), but the file gives them only for the HOPV molecules. A model that uses them looks very good on HOPV and cannot predict the lab or test molecules. You do not need them in this course.
Your Turn
Get the unique values and their counts for the columns construction, architecture, and complement.
Expected output:
--
construction
polymer     220
molecule    127
Name: count, dtype: Int64
--
architecture
bulk       270
DSSC        64
bilayer     13
Name: count, dtype: Int64
--
complement
PC61BM    139
PC71BM    133
TiO2       64
C60         9
ICBA        1
PDI         1
Name: count, dtype: Int64
# YOUR CODE HEREYour Turn
Generate summary statistics (count, mean, standard deviation, min, quartiles, max) for all numerical columns in the dataset.
# YOUR CODEYour Turn
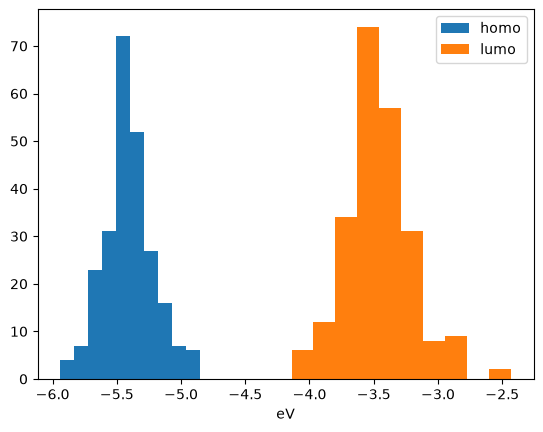
Plot the data distribution for homo and lumo columns.
# YOUR CODE HEREYour Turn
Generate a correlation matrix for the numerical columns in your dataset. Examine the strength and direction of these correlations, and reflect on what they might imply for your project. (The values are synthetic or adjusted, see the note above the column descriptions, but the relations between the columns follow those in the published data.)
# YOUR CODE HERE